The road network in SA
South Australia has an extensive network of roads.
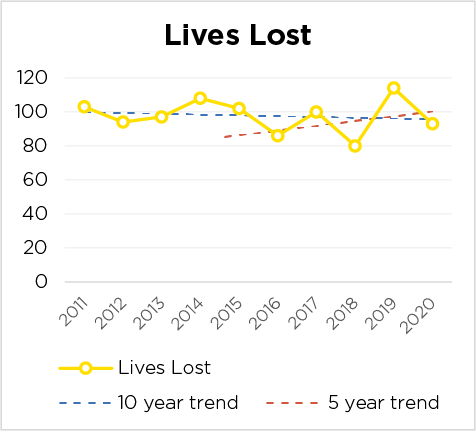
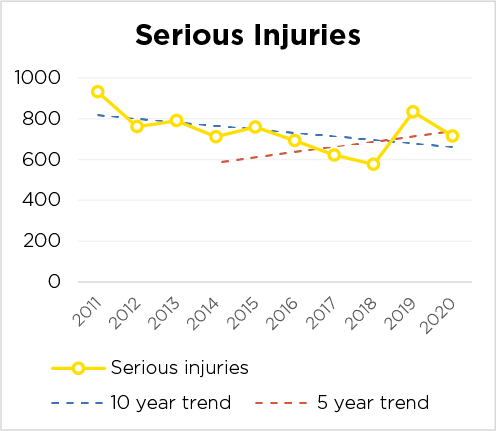
Most (64%) vehicle travel is on state and national roads that comprise 23% of the state’s road network. 68% of crashes where a life is lost and 61% of serious injury crashes occurred on state and national maintained roads in South Australia over the last five years, equating to an average of 66 lives lost and a further 428 serious injuries in crashes on these roads each year.
32% of crashes where a life is lost and 39% of serious injury crashes occurred on local government maintained roads in South Australia over the last five years, equating to an average of 28 lives lost and a further 259 serious injuries in crashes on local government roads each year.
| South Australian roads | Council roads | State roads* | ||
|---|---|---|---|---|
| Length | Proportion | Length | Proportion | |
| Sealed roads | 18,799 km | 60% | 12,796 km | 40% |
| Unsealed roads | 56,194 km | 85% | 9,623 km | 15% |
*State roads include National Highways


