Where crashes happen
Crashes where lives are lost or serious injury occurs
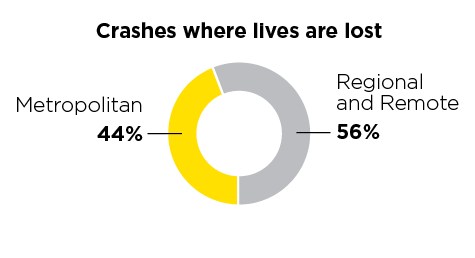
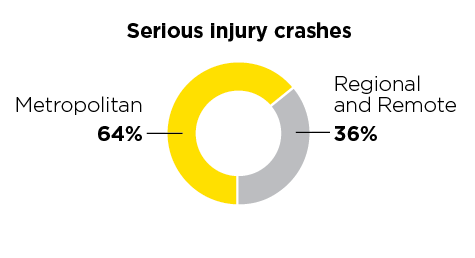
The majority of the crashes resulting in a life lost occur on regional and remote roads. This is the opposite when it comes to crashes resulting in serious injury with the majority of these occurring on metropolitan roads.
 |  |
| Regional and remote | Metropolitan | |
|---|---|---|
| Crashes where lives are lost | 56% | 44% |
| Serious injury crashes | 36% | 64% |
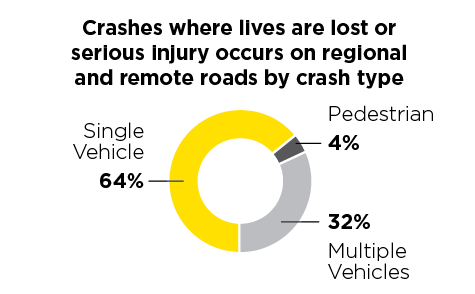
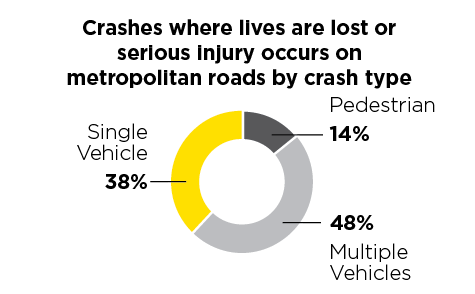
Almost two-thirds of the crashes resulting in a loss of life or serious injury on regional and remote roads are often single vehicle crashes that do not involve other vehicles or pedestrians. Many of these occur when the vehicle leaves the road and collides with an object, or rolls over. In comparison, the types of crashes that result in a loss of life or serious injury on metropolitan roads are more likely to involve more than one vehicle or a pedestrian.
 |  |
| Crash type | Regional and remote | Metropolitan |
|---|---|---|
| Single Vehicle | 64% | 38% |
| Multiple Vehicles | 32% | 48% |
| Pedestrian | 4% | 14% |
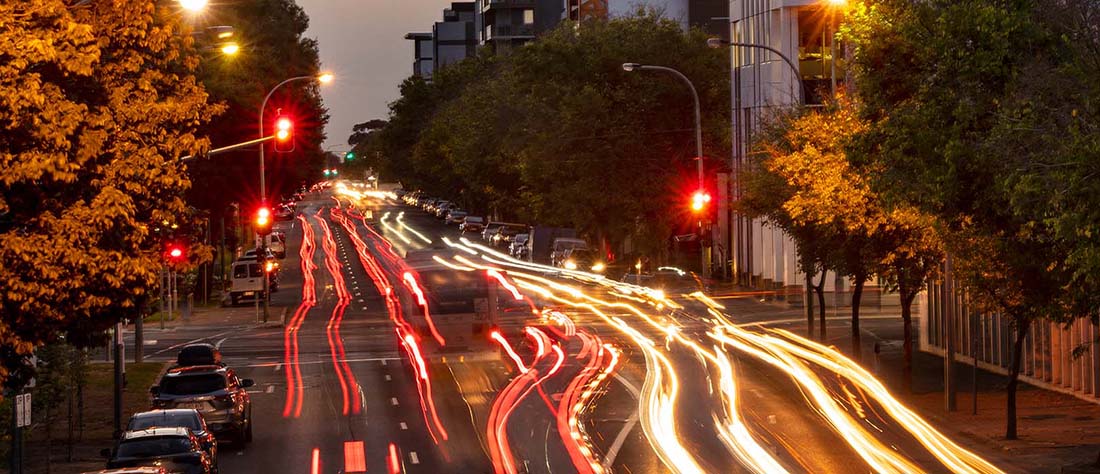
Metropolitan Adelaide and the CBD
Serious injury crashes are more likely to be on metropolitan roads, where large numbers of people live and work.
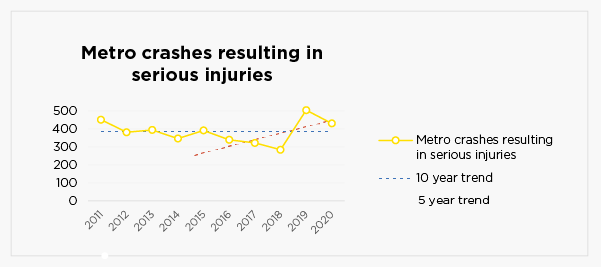
| Year | 2011 | 2012 | 2013 | 2014 | 2015 | 2016 | 2017 | 2018 | 2019 | 2020 |
|---|---|---|---|---|---|---|---|---|---|---|
| Crashes resulting in serious injuries | 451 | 381 | 394 | 346 | 391 | 339 | 322 | 284 | 504 | 430 |
Crashes resulting in serious injuries have shown a slight decline in trend over the previous ten years, with an average of 393 crashes per year recorded during 2011-2015 to 376 in the 2016-2020 period. The most recent five year trend however shows an increase.
38% of crashes resulting in loss of life or serious injury in the metropolitan area are single vehicle crashes, 48% involve more than one vehicle and 14% involve a pedestrian.
Pedestrians represent around one in every five lives lost and one in 10 serious injuries on metropolitan roads in South Australia.
30% of crashes where a life is lost and 44% of serious injury crashes in the metropolitan area occur at intersections. More than one third (36%) of these crashes are at intersections controlled by traffic signals, another one third (32%) have no intersection controls and the remainder are controlled by stop or give way signs or roundabouts.
Motorcycles are involved in 14% of crashes where a life is lost and 22% of serious injury crashes on metropolitan roads. Over half (54%) of these crashes involve another vehicle, with the majority of them (61%) occurring at an intersection.
Regional and remote SA
More than half (56%) of crashes where lives were lost and 36% of serious injury crashes are on regional and remote roads.
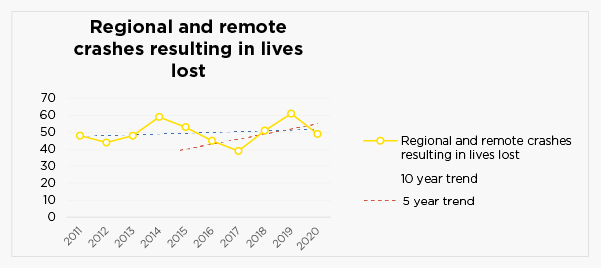
| Year | 2011 | 2012 | 2013 | 2014 | 2015 | 2016 | 2017 | 2018 | 2019 | 2020 |
|---|---|---|---|---|---|---|---|---|---|---|
| Crashes resulting in lives lost | 48 | 44 | 48 | 59 | 53 | 45 | 39 | 51 | 61 | 49 |
The ten-year trend shows the number of crashes on regional and remote roads resulting in lives lost have increased slightly with little change in the average. Fifty crashes were recorded per year in the five-year period 2011-2015 and 49 for the period 2016-2020. The five-year trend also shows an increase.
When taking into account the population, rates of driver and rider lives lost and serious injuries are much higher in regional and remote South Australia compared to metropolitan Adelaide.
The speed at which we travel has consequences for crash risk and also for injury severity when a crash occurs. 79% of all crashes on regional and remote roads where lives are lost and 70% of serious injury crashes occur on roads with a speed limit at 90km/h or above.
Nearly two-thirds of crashes where a life is lost or a person is seriously injured involve a single vehicle on a regional or remote road. Many of these are road departure crashes where the vehicle collides with an object or rolls over.
On higher volume, two-way undivided regional roads, head-on crashes become more likely. Head-on crashes often start the same way as run-off-road crashes, with a driver travelling onto the unsealed shoulder and losing control when they try to steer back into their lane on the different surface.